Time Zone: GMT +3
Time Frame: Daily (D1) / Weekly Outlook
Weekly Fundamental Overview:
The EUR/GBP currency pair continues to reflect shifting macroeconomic sentiment between the Eurozone and the UK economies. Market participants monitor underlying inflationary signals and monetary policy outlooks from European and British central bank officials, alongside broader regional risk dynamics.
Price Action:
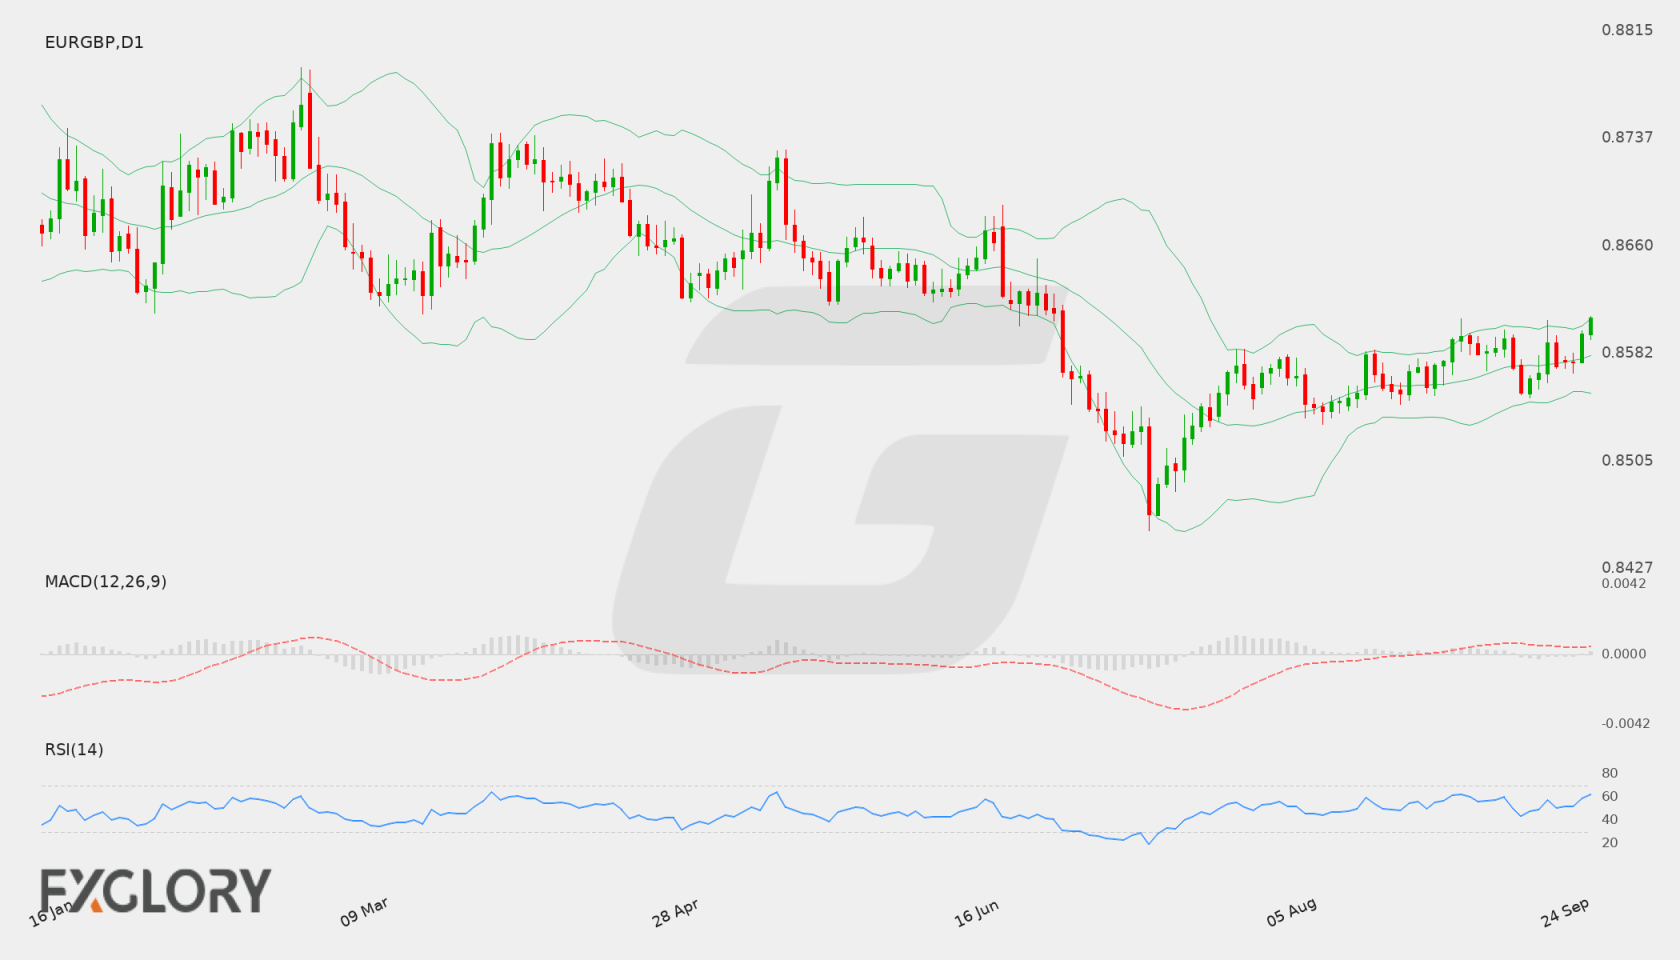
On the daily D1 chart, EUR/GBP closed at 0.86079 after climbing consistently from recent lows around 0.85722 and 0.85759. Price action is currently pressing against the technical resistance boundary near 0.86086, testing buyer strength at these elevated daily levels.
Key Technical Indicators:
Bollinger Bands: The Bollinger Bands indicator on the daily chart reflects a middle band at 0.85803, an upper band at 0.86070, and a lower band at 0.85536. EUR/GBP trading at 0.86079 puts price right along the upper band, indicating bullish expansion and increased volatility.
RSI: The 14-day Relative Strength Index (RSI) is recorded at 61.78. This reflects strong buying momentum while remaining below the overbought threshold of 70.
MACD: The daily MACD line stands in positive territory at 0.000639. This above-zero reading highlights sustained bullish momentum over recent trading sessions.
Support and Resistance:
Key technical levels for EUR/GBP include immediate resistance at 0.86086 and dynamic support at the middle Bollinger Band of 0.85803. Major structural support is identified further down at 0.8454.
News to Watch for EURGBP This Week:
- German Prelim CPI m/m: This release offers essential inflation data from Germany that may impact Euro sentiment and central bank rate expectations.
Weekly Outlook and Consideration:
EUR/GBP maintains a bullish tone as it approaches technical resistance at 0.86086 with a daily close of 0.86079. Indicator support from a positive MACD of 0.000639 and an RSI of 61.78 suggests upward pressure remains active. If buyers manage to push decisively past 0.86086, the pair could see continued bullish expansion. Conversely, a rejection at resistance could prompt a consolidation or pullback toward the middle Bollinger Band near 0.85803, with major downside protection anchored at 0.8454.
Disclaimer: The analysis provided for EUR/GBP is for informational purposes only and does not constitute investment advice. Traders are encouraged to perform their own analysis and research before making any trading decisions. Market conditions can change quickly, so staying informed with the latest data is essential.