Time Zone: GMT +3
Time Frame: Daily (D1) / Weekly Outlook
Weekly Fundamental Overview:
USD/MXN traders will closely monitor upcoming economic data releases from the United States, including key inflation measures and consumer sentiment indicators. These macroeconomic drivers could influence Federal Reserve policy expectations and alter yield differentials against the Mexican Peso.
Price Action:
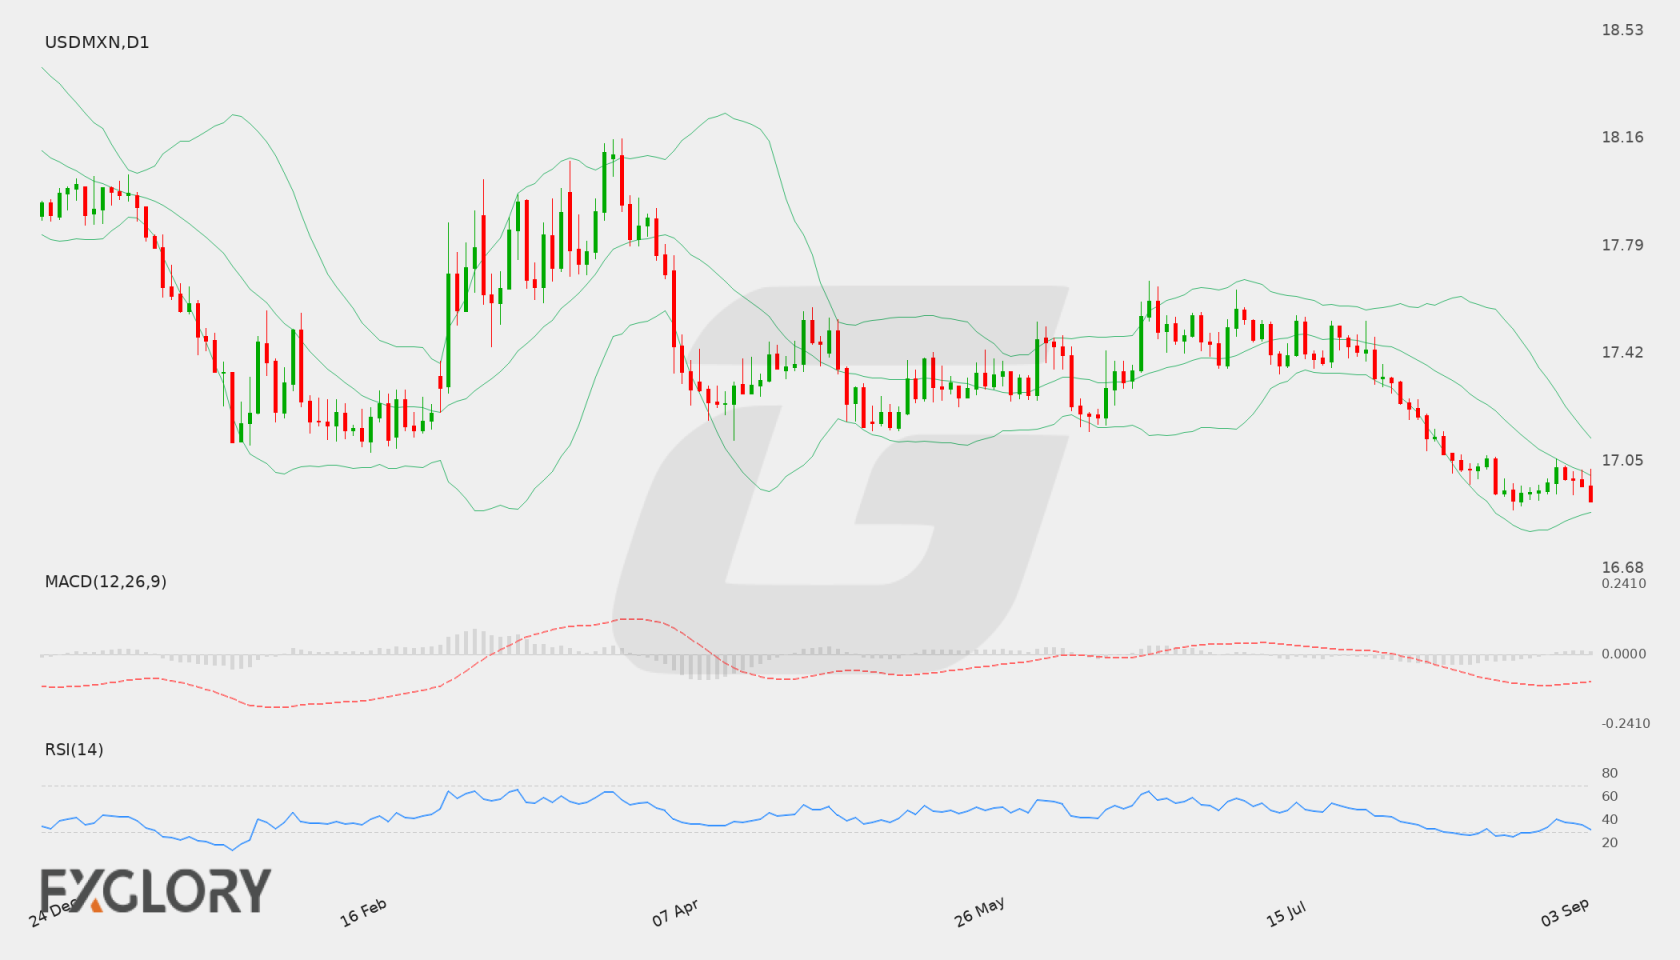
On the daily chart, USD/MXN has drifted lower over recent sessions, moving down from the 17.02791 high to close at 16.91427. The sustained downward trajectory reflects persistent bearish pressure as price approaches critical support levels.
Key Technical Indicators:
Bollinger Bands: The daily Bollinger Bands place the middle band at 17.00164, the upper band at 17.12969, and the lower band at 16.87358. With USD/MXN closing at 16.91427, price trades near the lower band, reflecting a downward trajectory and potential volatility expansion if lower boundaries are tested.
RSI: The 14-day Relative Strength Index (RSI) stands at 31.89. Positioned just above the oversold threshold of 30, it underscores firm bearish momentum while leaving room for potential market stabilization or downside continuation.
MACD: The MACD indicator prints a negative value of -0.08485, remaining below the zero line. This signal reflects ongoing momentum in favor of the bears for USD/MXN on the daily timeframe.
Support and Resistance:
Technical levels on the daily chart indicate immediate support near 16.88135, aligning close to the lower Bollinger band. On the upside, resistance is identified at 17.66976, marking a key barrier against potential bullish recovery attempts.
News to Watch for USDMXN This Week:
- PPI m/m: Measures producer price inflation changes which can affect broader U.S. dollar valuation.
- Core PPI m/m: Excludes volatile food and energy costs to gauge underlying producer price pressure.
- Unemployment Claims: Offers weekly insight into U.S. labor market conditions that influence economic sentiment.
- Core CPI m/m: Provides a key measure of underlying consumer inflation that impacts U.S. monetary policy expectations.
- CPI y/y: Tracks headline annual consumer inflation trends, providing direction for global risk appetite and dollar strength.
- Core CPI y/y: Highlights persistent annual inflation pressures excluding food and energy.
- CPI m/m: Captures monthly shifts in consumer prices that directly influence dollar dynamics.
- Prelim UoM Inflation Expectations: Assesses consumer long-term inflation outlooks that impact monetary expectations.
- Prelim UoM Consumer Sentiment: Reflects household confidence and overall U.S. economic strength.
Weekly Outlook and Consideration:
USD/MXN approaches the pivotal 16.88135 support region as bearish indicators like a negative MACD of -0.08485 and an RSI of 31.89 persist. A decisive break below support could push price toward lower territory near the 16.87358 lower Bollinger band, whereas a hold above support might encourage a rebound toward the 17.00164 middle band or key resistance at 17.66976.
Disclaimer: The analysis provided for USD/MXN is for informational purposes only and does not constitute investment advice. Traders are encouraged to perform their own analysis and research before making any trading decisions. Market conditions can change quickly, so staying informed with the latest data is essential.